COVID-19 in the Bay Area
Bay Area COVID-19 Dashboard
This page is a mirror of the README in the slwatkins/covid GitHub repository. The repo was intended for simple plotting and analyzing COVID-19 cases/deaths, with a focus on the San Francisco Bay Area. The data in the plots below are from the John Hopkins University dataset. The plots below are easily reproducible using the Python code in the repo (which has been organized as an installable package). The package also has useful functions for reading in the COVID-19 data from both the JHU and NY Times datasets.
The Bay Area counties included are:
- Alameda
- Contra Costa
- Marin
- Napa
- San Francisco
- San Mateo
- Santa Clara
- Solano
- Sonoma
Interactive Plots of Current Bay Area Cases
Below, we show the cumulative cases over time for each of the 9 Bay Area counties.
Click here to open the plot directly.
Below, we show the daily new cases for each of the 9 Bay Area counties.
Click here to open the plot directly.
Current Bay Area Numbers (Combined)
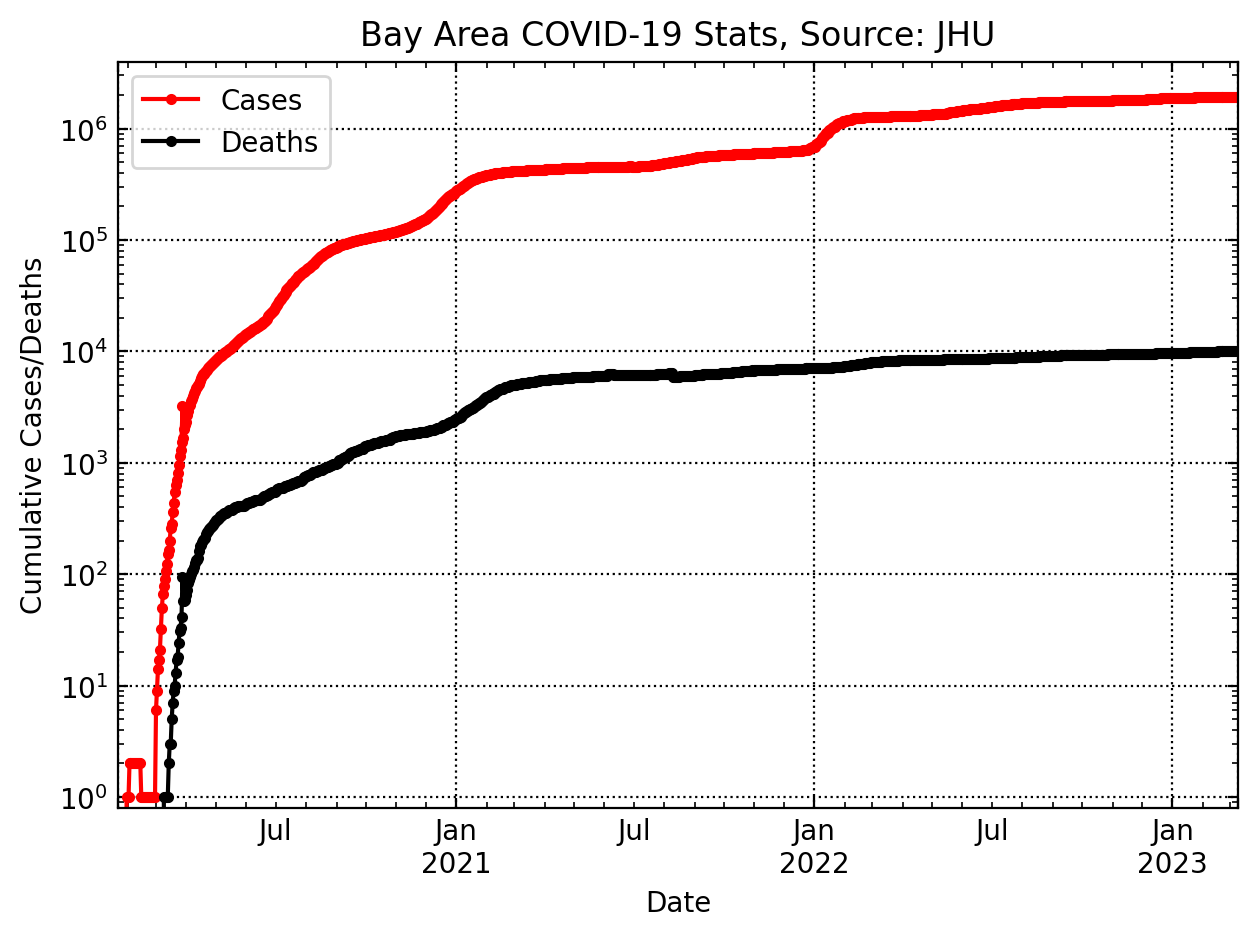
Below, we show the total, cumulative cases (and deaths) over time for the combined 9 Bay Area counties.
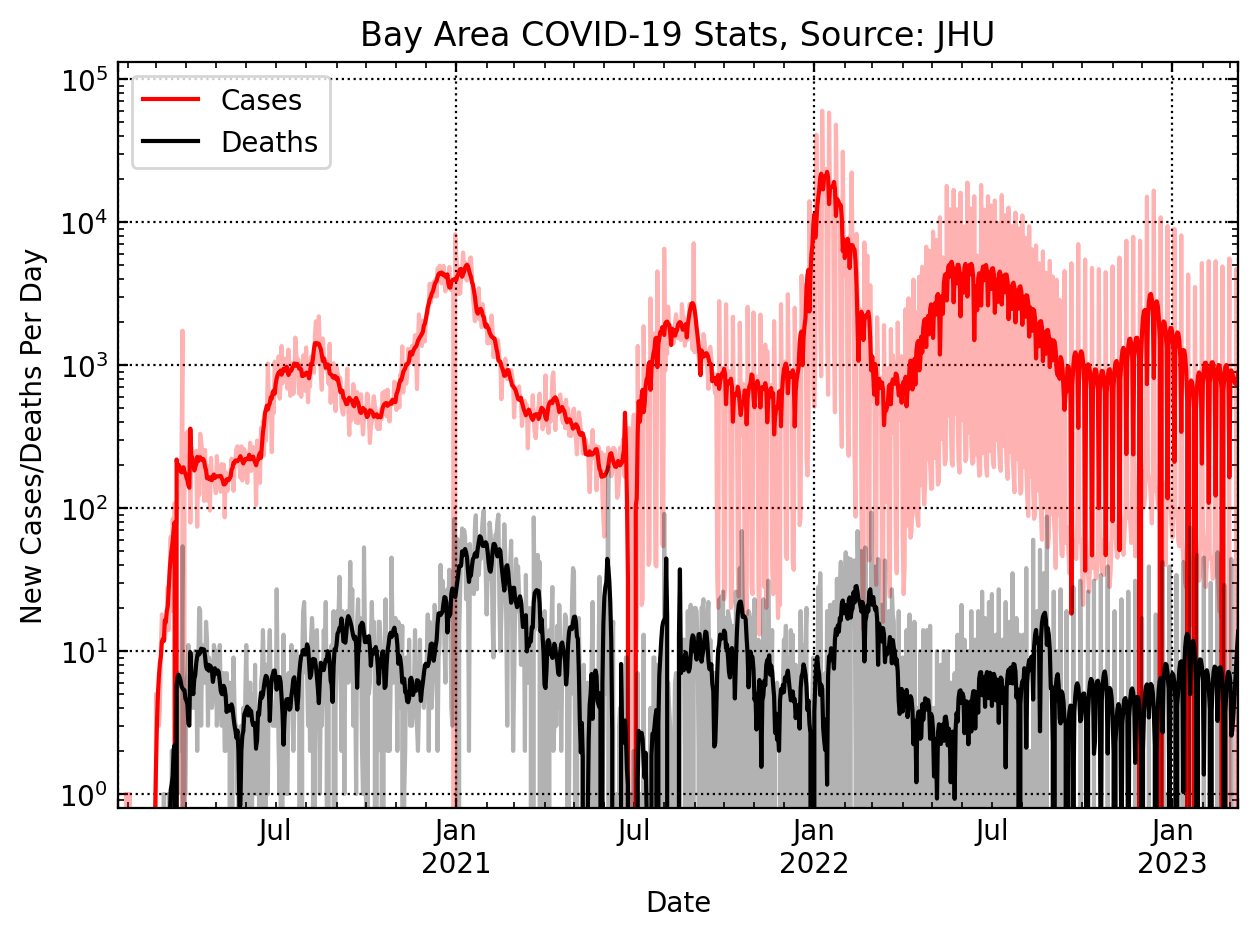
Below, we show the daily new cases (and deaths) over time for the combined 9 Bay Area counties.
County-by-County Numbers
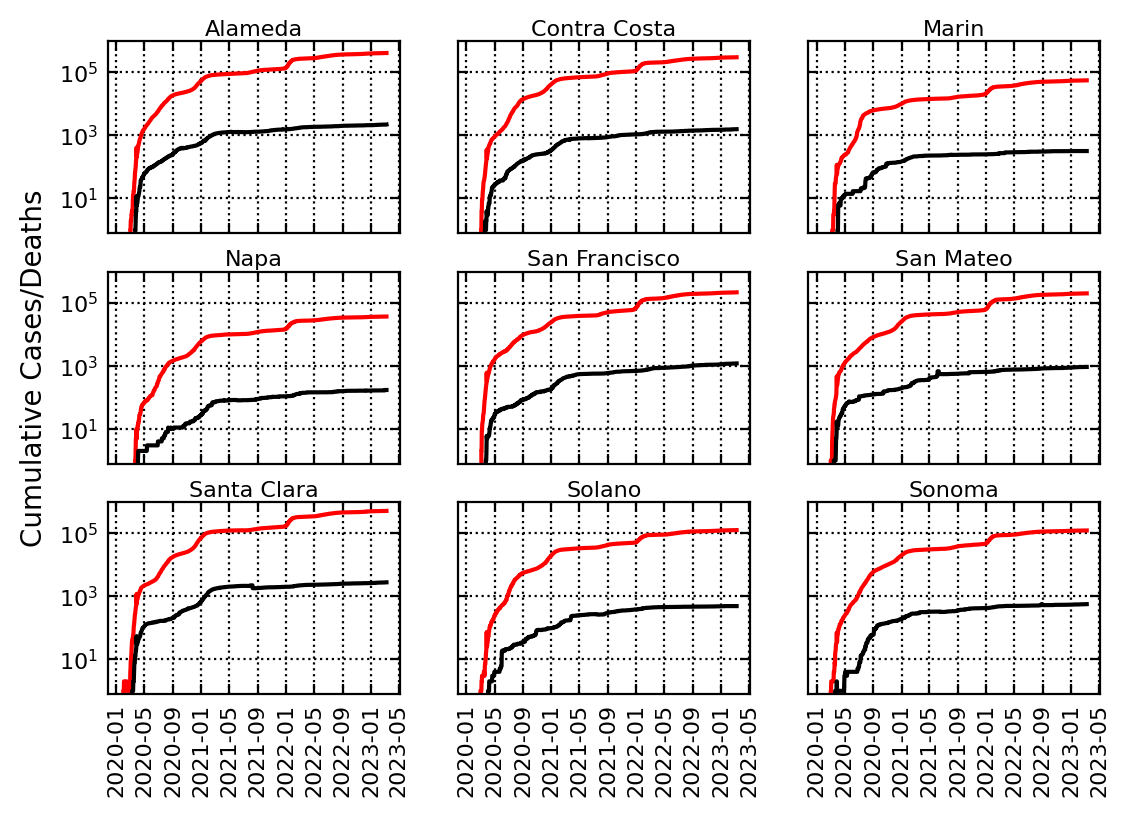
Below, we show the total, cumulative cases (and deaths) over time for each of the 9 Bay Area counties.
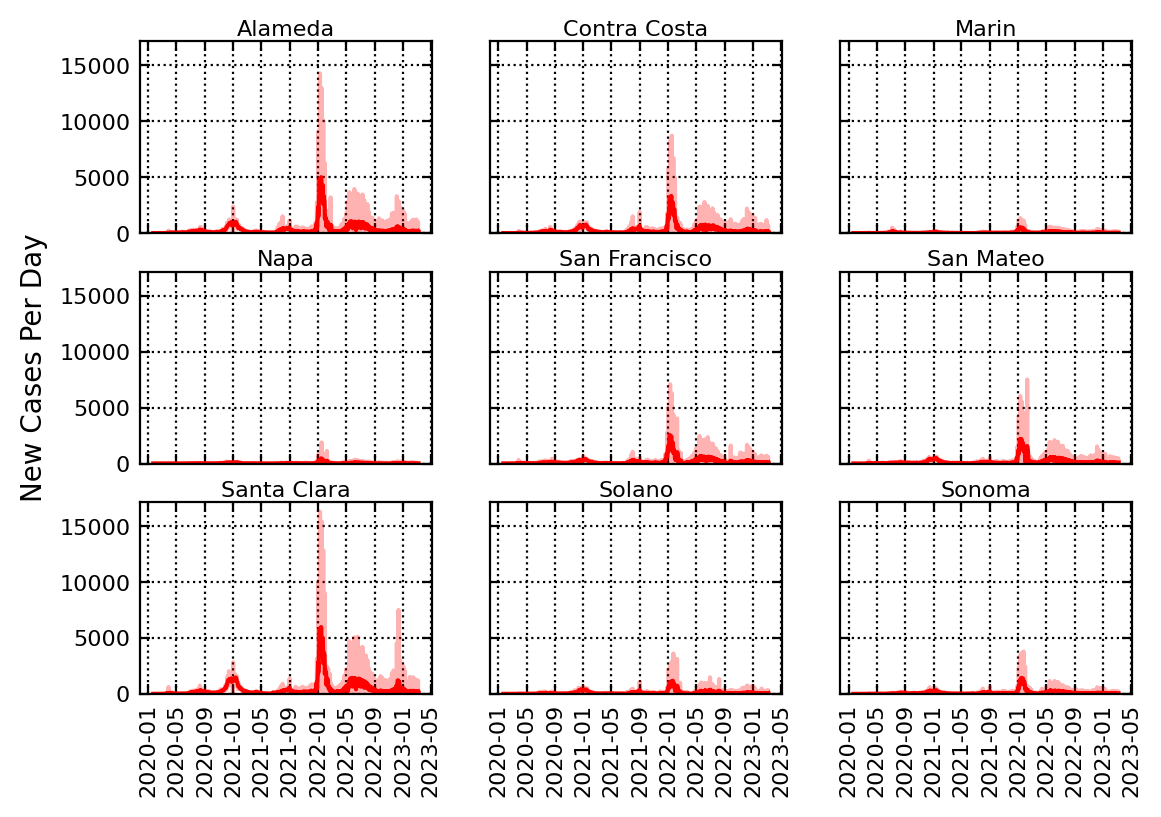
Below, we show the daily new cases over time for each of the 9 Bay Area counties.
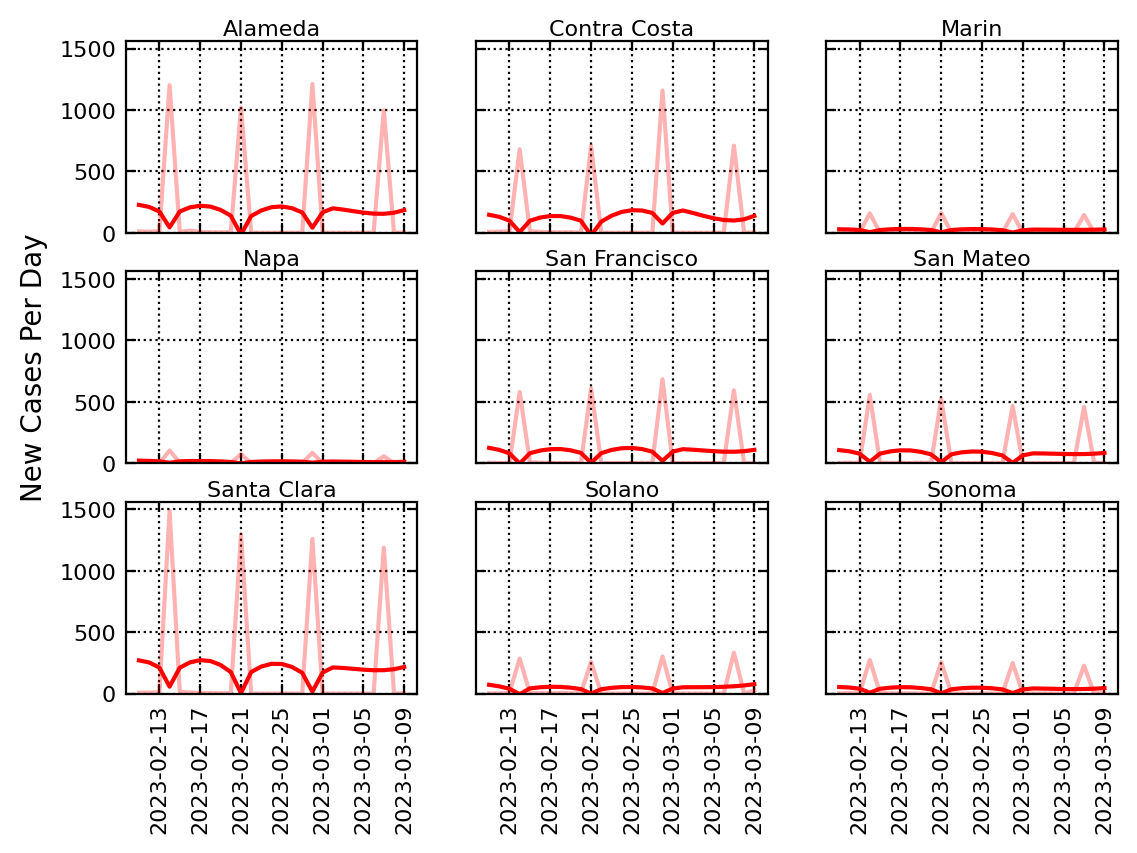
Below, we show the daily new cases over the last month for each of the 9 Bay Area counties.